The Dashboard allows the user to quickly access important creditor information upon login. It also provides statistics that will allow the user to have an overview of the current mandates and SDDs.
Six pages are accessible from the Dashboard:
-
Overview Dashboard: It provides an overview of all active, cancelled, and pending mandates filtered by creditor entity in a table and in a matrix. Alerts that require user attention are also displayed;
This page is very long to load because can contain a lot of information, so it is loaded only if the user clicks on the link to load the page. The left menu is still clickable for the user who does not want to stuck on a page loading.

-
Mandates Stats: After selecting the creditor entity and a time period, this page displays statistics related to the mandates;
-
Cash Forecast: It provides, for a selected creditor entity, expected financial activities related to each associated mandate for a next eight working days period;
-
Operator Log: An administrator can view all the modifications, all actions on the software are available for consultation.
-
SDD Stats: After selecting the creditor entity and a time period, two pie charts and a table display:
-
The number of SDDs filtered per status (first, final, one-off, recurring);
-
The total amount per status.
-
-
SCT Stats: After selecting the creditor entity and a time period, two pie charts and a table display:
-
The number of SCTs filtered per status (first, final, one-off, recurring);
-
The total amount per status.
-
“Mandates Dashboard” Page
This page, available through Home > Dashboard: Mandates Dashboard is divided into 4 blocks and one action button.

It aims to provide the user with a synthetic view of all mandates, transactions, collections and notifications (the table at the bottom of the page) and attracts his attention on elements that require human intervention. Information can be filtered through the “Creditor filter” block.
Two other blocks list all unacknowledged alerts and the last received ones (“Unacknowledged alerts” and “Last received alerts” blocks).
The following subsections explain these blocks in details:
-
Creditor filter;
-
Overview;
-
Alerts:
-
Unacknowledged alerts;
-
Last received alerts.
-
-
Pending Mandates;
Creditor Filter
The “Creditor filter” block let the user choose a creditor entity from which information will later be filtered (see Choosing a Creditor Entity).
Overview
This overview allows a creditor user to quickly identify objects that require immediate action.
This block allows SPS users to see how many mandates, transactions, collections and notifications are available depending on their status.
The table is divided into tabs that list statuses that are considered abnormal. A counter displays the number of elements that have the corresponding status; an action column gives the user the opportunity to fix the issues.

Alerts
Two blocks give an overview of every alert received during the last month.
Unacknowledged Alerts
The block summarizes information from the “Alerts Management” block. Available data include:
-
Number of critical alerts, shown in red;
-
Number of major alerts, shown in orange;
-
Number of minor alerts, shown in green.
-

Alerts details are thoroughly described in Alerts Management.
Last Received Alerts
This block allows the user to view the five latest received alerts. Those alerts are grouped by alert labels and the date of the last received alert is shown on the left of the block.
The color of the events displayed is the same as the criticality of the alerts (red for critical, orange for major and black for minor).

The user can access the alert details by clicking the [Alert details] action button.
For more information on alert details, please see Alerts Management.
Table of objects sorted by status
The creditor user has access to a table that summarizes the objects that require his attention. The table is composed by several tabs that must be clicked on to display the relevant information. Every tab features the list of objects requiring action, their status and the number of similar objects. A link is also available to a detailed page for every object.
The following table references the actions to be taken depending on the object status:
| Object | Status | Action |
|---|---|---|
| Mandate | Pending | Contact the debtor again so he can complete the mandate |
| Sent to debtor | Contact the debtor again to acquire the signed mandate | |
| Waiting reachability | Contact the debtor to obtain a new bank account number or find another payment method | |
| Waiting for validation | Validate if the user has sufficient rights | |
| Suspended | Activate the mandate if required | |
| Transaction | Obsolete | Edit the SDD’s due date |
| Waiting for validation | Validate if the user has sufficient rights | |
| Rejected (last week) | Contact the debtor or reissue the transaction | |
| Returned (last week) | Contact the debtor or reissue the transaction | |
| Erroneous transaction | Manually edit transactions to recycle them | |
| Collection | Obsolete | Edit the collection’s due date |
| Waiting for validation | Validate if the user has sufficient rights | |
| Partially rejected | Contact the debtor or reissue the collection | |
| Rejected (last week) | Contact the debtor or reissue the collection | |
| Notification | Pending (last week) | Contact the debtor to update his information and reissue the notification |
“Mandates Stats” Page
This page let the user view the number of mandates depending on their respective status.

Two additional filters are available: the creditor entity and the signature date.
The table on the left summarizes the results by status; said statuses are then displayed on the pie chart on the right: distribution of the number of mandates by status.
Creditor Filter: Creditor Entity and SCI
The “Creditor Filter” block enables the user to choose a creditor entity and an SCI account to refine his search (see Choosing a Creditor Entity and an SCI).
Choosing a Date (Signature Date)
A “Signature date” block let the user define a search period for the mandate’s signature date.

Available choices are:
-
A predefined time period (Last week/month/year elapsed);
-
Or a custom range defined by the user.
To select a custom time table, click on “User defined”. Two date fields appear automatically. By clicking the calendar icons, choose a start and an end date.

Results Display
The results are presented in both a table on the left and a pie chart on the right of the page.
The display settings are set by default to:
-
Creditor filter: the creditor entity associated to the current user;
-
SCI: all are selected;
-
Signature date: time period is set to “Last week”.
The first block on the left show the number of mandates for each status on a table:

The block on the right displays these results on a color-coded pie chart.

The user can choose to change the filters and dates default settings. When hitting [Display], the table and the pie chart are updated with the new values set on the search blocks.
If the user hits [Reset], all criteria are reset to their default values. The table and pie chart are reloaded with the default values as well.
Exporting the Results
If a mandate exists for the creditor entity and the time period selected, an [Export] button appears next to [Display] and [Reset]. This button allows exporting the search results to a format akin to the “Results summary” table.

“Cash Forecast” Page
The Cash Forecast page displays for each creditor entity, bank and SCI account the total amount of transactions that will be processed within the next few workdays. It is thus possible to estimate the cash flow for a selected day.

The user can filter the results by selecting a creditor entity and an SCI account.
The results will be displayed in a table within which the expected cash entries for the next 8 days are displayed and sorted by node and bank account.
Each cell of the table that displays an amount of cash is clickable and shows in another block the associated SDDs, SCTs or R-Transaction.

The value date has initialized by the due date, when the settlement is done, the field is set with the value date.
A button at the top right corner of the page let the user download a summary of the cash forecast.
Selecting Search Criteria
The “Creditor filter” block allows the user to select the creditor entity and the SCI account to filter the search results (see Choosing a Creditor Entity and an SCI).
Displaying the Results
The “Creditors” block displays as a table, for each SCI/Bank association that matches the search criteria, the cash flow for the next eight workdays. A cash amount is computed for every day and for every row.
The user can see the cash amount only if user is associated with “View Transaction Amount” profile.

If user is not associated with “View Transaction Amount” profile then cash amount is shown in masked format.

Each cell of the table that displays an amount of cash is clickable and shows in another block the associated transactions.
Displaying Associated Transactions
When the user clicks on a cash amount, the “Associated transaction” block appears at the bottom of the page as a table. The associated SDDs, SCTs, and R-Transactions, as well as their respective cash transactions are displayed within it.
The image below depicts both:
-
The “Creditors” block;
-
The “Associated transaction” block.

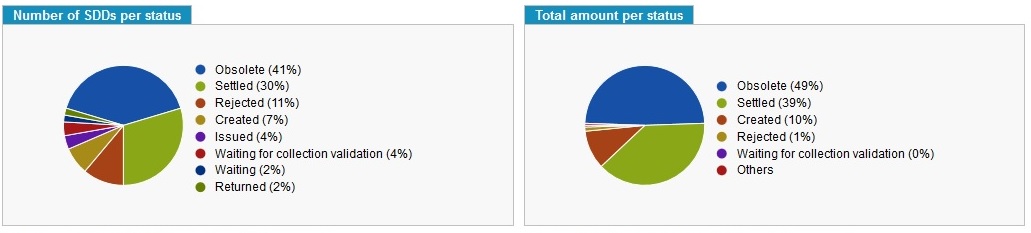
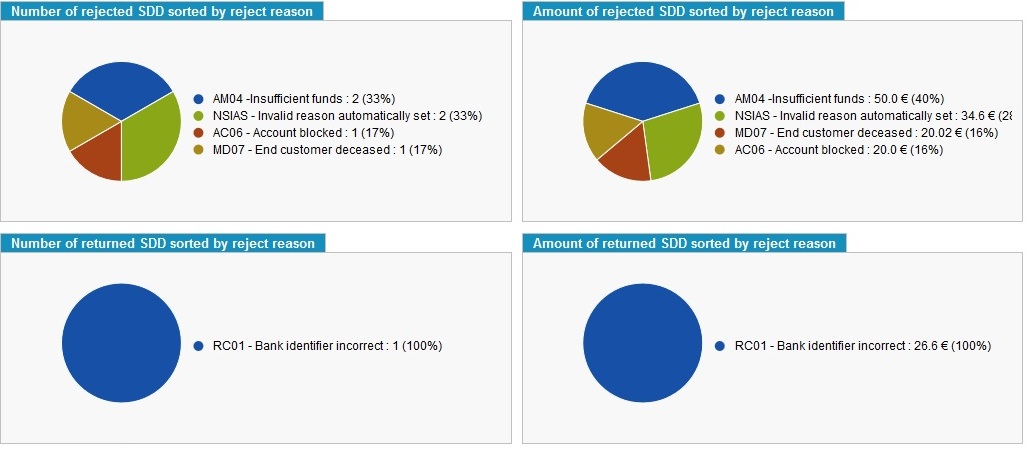
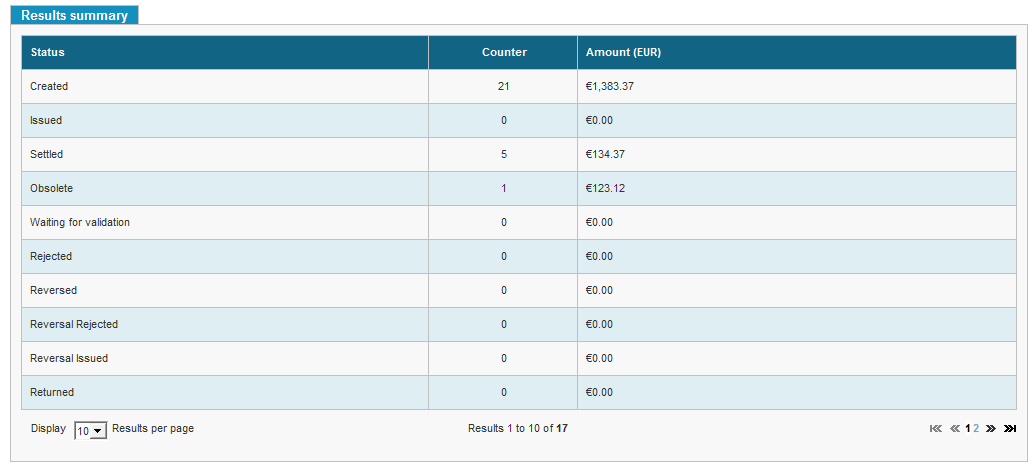
“SDD Stats” Page
This page summarizes the number of SDDs and their respective amounts, depending on their status, and summarizes the number of rejected and returned SDD sorted by reject reason and their respective amount.
The user selects a creditor entity and an SCI from the “Creditor filter” block. It is also possible to specify a date as an additional filter.
There are six diagrams:
-
The two first diagrams summarize the number of SDDs per status and the amount of cash associated per status.
-
The next two diagrams summarize the number of rejected SDDs per reject reason and the amount of cash associated per reject reason.
-
The two last diagrams summarize the number of returned SDDs per reject reason and the amount of cash associated per reject reason.
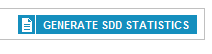
A button at the top of the page can be clicked to download a summary of the SDDs statistics.
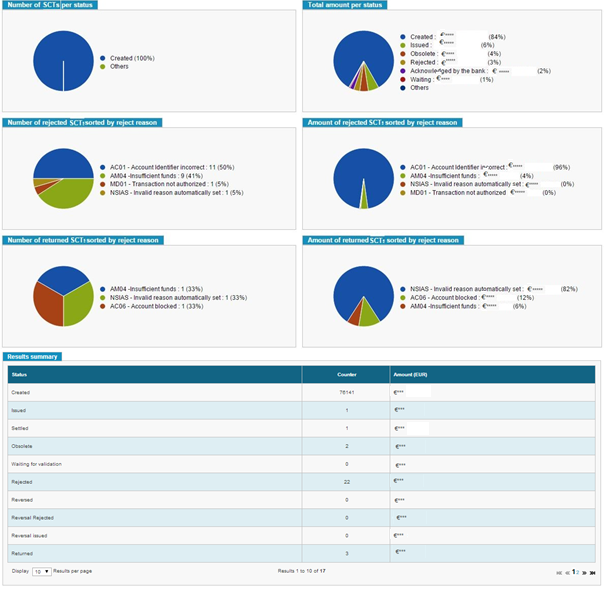
If the user is not associated with the “View Transaction Amount” profile, then following amounts will be shown in masked format
-
Amount of cash associated per status
-
Amount of cash associated per reject reason for rejected SDDs
-
Amount of cash associated per reject reason for returned SDDs
Otherwise these will be shown in unmasked format.


Selecting the Search Criteria
The “Creditor filter” block let the user choose a creditor entity and an SCI account (see Choosing a Creditor Entity and an SCI).
The “Selection criteria” block allows inputting a value date for an SDD. The content and behavior of this block is strictly identical to the one seen in Home > Creditor > Dashboard: Mandates Stats (see Choosing a Date (Signature Date)).
Displaying the Associated SDDs
This page displays six types of results related to the SDDs:
-
The number of SDDs per status in a first pie chart;
-
The total amount of SDDs per status in another pie chart;
-
The number of rejected SDDs sorted by reject reason;
-
The amount of rejected SDDs sorted by reject reason;
-
The number of returned SDDs sorted by reject reason;
-
The amount of returned SDDs sorted by reject reason;
-
A summary of the two pie charts in a table.
The default search parameters are as follows:
-
Creditor filter: the creditor entity associated to the current user;
-
SCI: all;
-
Time period: last day.
The two first charts display the number of SDD per status and there amounts. The legend of each chart is in its right.
The next four charts display the number of rejected and returned SDD and their amounts, sorted by reject reasons.
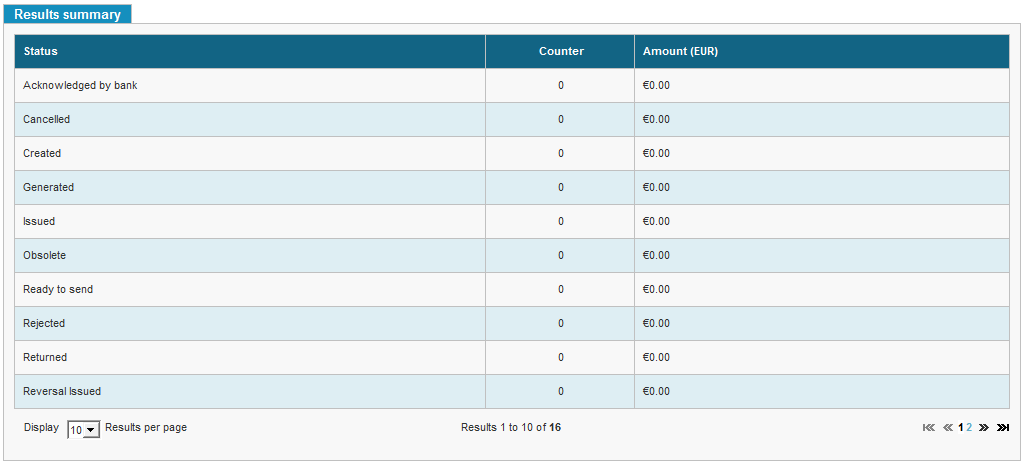
The last block summarizes the number of SDDs and their respective amounts per status in a table.
The user can choose to change the filters’ default values. By clicking the [Display] button, the pie charts and the table are automatically updated to include the new values.
By clicking [Reset], all search filters are restored to their default values and the charts/table are updated accordingly.
Exporting the Results
The user can download the search results on a CSV file.
The [Generate SDD statistics] Button
Located at the top right corner of the page, this button allows the user to download a summary of the SDD activity.
This daily summary contains the following data:
-
For each creditor/SCI:
-
The number of payment requests submitted to SPS;
-
The number of payment requests accepted by SPS;
-
The total amount of payment requests accepted by SPS;
-
The number of SDDs computed by the payment scheduler;
-
The number of SDDs computed by the payment scheduler and accepted by SPS;
-
The amount of SDDs computed by the payment scheduler and accepted by SPS;
-
The number of SDDs sent to the bank;
-
The amount of SDDs sent to the bank;
-
The number of cancellation requests sent to SPS;
-
The number of cancellation requests accepted by SPS;
-
The total amount of cancellation requests accepted by SPS;
-
The number of reversal requests sent to SPS;
-
The number of reversal requests accepted by SPS;
-
The total amount of reversal requests accepted by SPS;
-
The number of reversals sent to the bank;
-
The amount of reversals sent to the bank.
-
For each account (BIC/IBAN):
-
The number of SDDs sent to the bank;
-
The amount of SDDs sent to the bank;
-
The number of reversals sent to the bank,
-
The amount of reversals sent to the bank.
The [Export] Button
If mandates exist after a creditor entity and a time period were selected, an [Export] button will appear next to [Display] and [Reset].
This button allows exporting a CSV file that contains the search results and displayed as a table akin to the “Results summary” block.

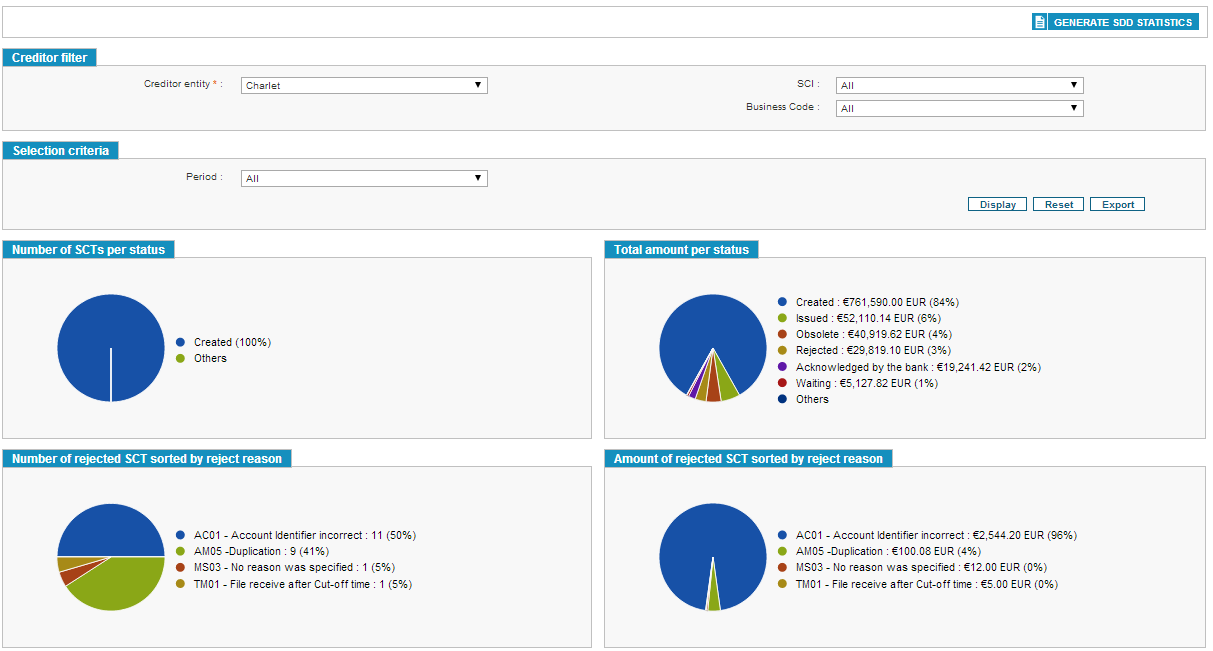
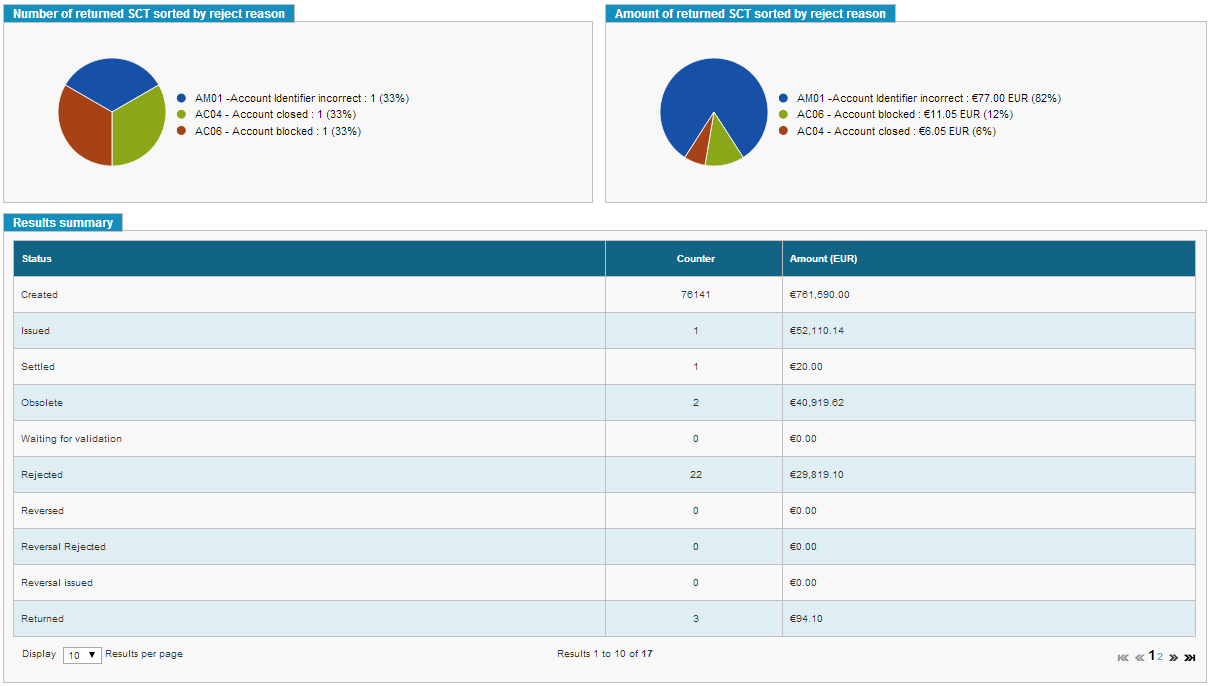
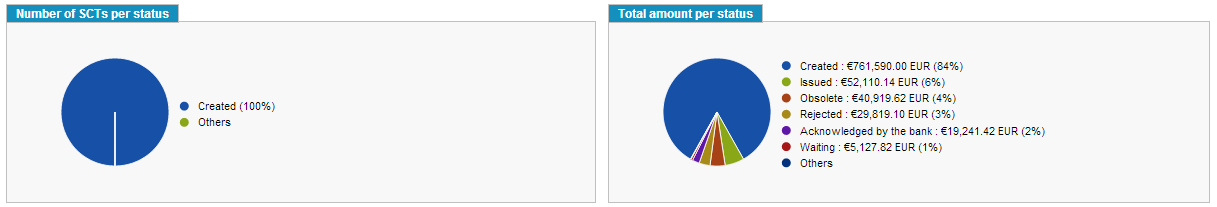
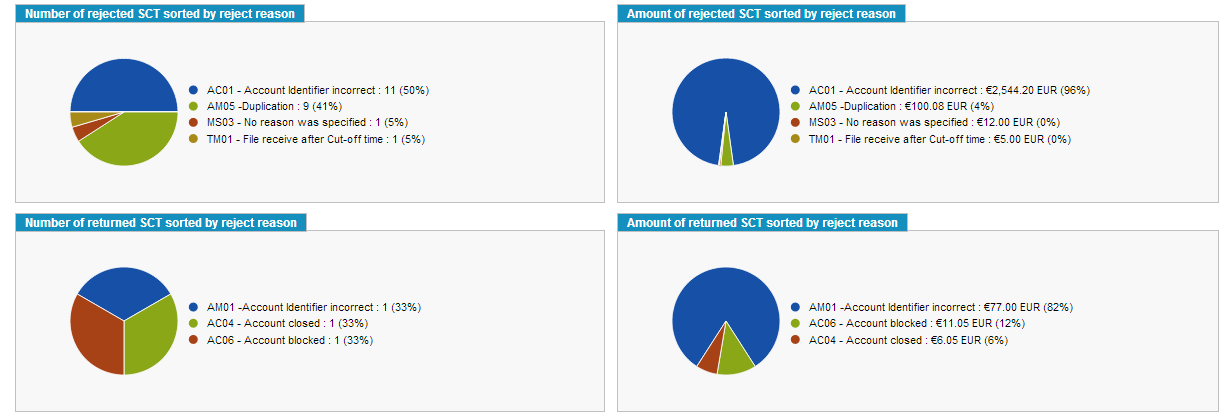
“SCT Stats” Page
This page summarizes the number of SCTs and their respective amounts, depending on their status, and summarizes the number of rejected and returned SCT sorted by reject reason and their respective amount and summary table.
The user selects a creditor entity and an SCI from the “Creditor filter” block
This page presents the same features and design elements that the “SDD stats” page.
There are six diagrams:
-
The two first diagrams summarize the number of SCTs per status and the amount of cash associated per status.
-
The next two diagrams summarize the number of rejected SCTs per reject reason and the amount of cash associated per reject reason.
-
The two last diagrams summarize the number of returned SCTs per reject reason and the amount of cash associated per reject reason.
If the user is not associated with the “View Transaction Amount” profile, then following amounts will be shown in masked format
-
Amount of cash associated per status
-
Amount of cash associated per reject reason for rejected SCTs
-
Amount of cash associated per reject reason for returned SCTs
Otherwise these will be shown in unmasked format.
A button at the top of the page can be clicked to download a summary of the SCTs statistics
Selecting the Search Criteria
The “Creditor filter” block let the user choose a creditor entity and an SCI account (see Choosing a Creditor Entity and an SCI).
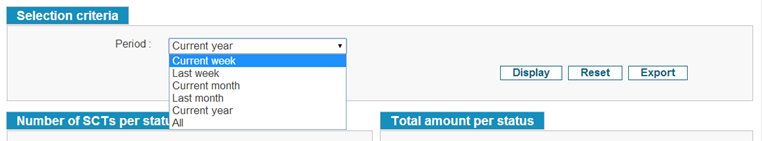
A “Selection criteria” block let the user define a search period. The possible values of the period are
-
Current week
-
Last week
-
Current month
-
Last month
-
Current year
-
All
Displaying the SCTs
This page displays following results related to the SCTs in the form of pie charts:
-
The number of SCTs per status;
-
The total amount of SCTs per status;
-
The number of rejected SCTs sorted by reject reason;
-
The amount of rejected SCTs sorted by reject reason;
-
The number of returned SCTs sorted by reject reason;
-
The amount of returned SCTs sorted by reject reason;
-
A summary of the six pie charts in a table.
The default search parameters are as follows:
-
Creditor filter: the creditor entity associated to the current user;
-
SCI: all;
-
Time period: Current week.
The first two charts display the number of SCT per status and there amounts. The legend of each chart is in its right.
The next four charts display the number of rejected and returned SCT and their amounts, sorted by reject reasons.
A last block summarizes the number of SCTs and their respective amounts per status in a table.
The user can choose to change the filters’ default values. By clicking the [Display] button, the pie charts and the table are automatically updated to include the new values.
By clicking [Reset], all search filters are restored to their default values and the charts/table are updated accordingly.
Exporting the Results
The user can download the search results on a CSV file.
The [Generate SCT statistics] Button
Located at the top right corner of the page, this button allows the user to download a summary of the SCT activity.
This daily summary contains the following data:
-
For each creditor/SCI:
-
The number of payment requests submitted to SPS;
-
The number of payment requests accepted by SPS;
-
The total amount of payment requests accepted by SPS;
-
The number of SDDs computed by the payment scheduler;
-
The number of SDDs computed by the payment scheduler and accepted by SPS;
-
The amount of SDDs computed by the payment scheduler and accepted by SPS;
-
The number of SDDs sent to the bank;
-
The amount of SDDs sent to the bank;
-
The number of cancellation requests sent to SPS;
-
The number of cancellation requests accepted by SPS;
-
The total amount of cancellation requests accepted by SPS;
-
The number of reversal requests sent to SPS;
-
The number of reversal requests accepted by SPS;
-
The total amount of reversal requests accepted by SPS;
-
The number of reversals sent to the bank;
-
The amount of reversals sent to the bank.
-
For each account (BIC/IBAN):
-
The number of SCTs sent to the bank;
-
The amount of SCTs sent to the bank;
-
The number of reversed SCTs,
-
The amount of reversed SCTs.

The [Export] Button
If mandates exist after a creditor entity and a time period were selected, an [Export] button will appear next to [Display] and [Reset].
This button allows exporting a CSV file that contains the search results and displayed as a table akin to the “Results summary” block.